Banks could have an important role in the allocation of credit and provide other useful financial services. These services could be provided by private and public banks. Are there differences in banks’ performance conditionally on private versus public ownership? Does the home-country corruption level affect the banks’ financial indicators?
To provide answers to these two questions, on the effect of ownership and country-level corruption on banks’ performance, we use the Bankscope database and the International Transparency Corruption Index. We use information of 35,603 banks worldwide, between 2012 and 2018. We analyze the behavior of 854 public banks relative to 34,749 private banks. Country-level measures of corruption are constructed using the International Transparency Perception Index.
To get these results, we estimate the following equation:
Yit = α + β1 * ownershipit + β2 * corruptionit + ηi + uit
where Yit are the banks’ performance indicators, with banks indexed by i, and year denoted by t. ownershipit is a dummy variable which takes a value of 1 if the bank has public sector ownership, relative to a bank with private ownership. Public sector ownership is identified as those institutions in which ultimate beneficiary is a public authority or ultimate beneficiaries are public authorities in the bank ownership status. International Transparency Perception Index is in a 0 to 100 scale with lower values associated to more corrupt countries. To have a direct relationship between our corruption indicator, corruptionit, and the level of corruption, we transform it taking a value of 100 and subtracting the original index.
The estimation is performed with Generalized Least Squares and Random Effects. In the regression we control for year, country, size, and specialization. Size is measured by the logarithm of assets. Specialization have the following 17 categories: i) commercial bank, ii) private banking / asset management company, iii) investment bank, iv) Islamic bank, v) finance company (credit card factoring & leasing), vi) cooperative bank, vii) micro-financing institution, viii) investment & trust corporation, ix) bank holding & holding company, x) clearing institution / custody, xi) group finance company, xii) real estate & mortgage bank, xiii) savings bank, xiv) securities firm, xv) multilateral government bank, xvi) specialized governmental credit institution, and xvii) other non-banking credit institution. Central banks are excluded from the sample.
The banks’ performance indicators, with sample averages in parenthesis, include: i) loans over assets in percentage (45.07%), ii) non-performing loan (NPL) ratio in percentage (7.37%), iii) return before taxes over equity in percentage (8.2%), iv) equity over assets in percentage (19.34%), v) income per employees, measured in USD divided by the number of employees ($28,227), vi) cost over assets (4.47%), and vii) interest income as a share of the income generating assets (11.35%). Those indicators are listed in the first column of Table 1, while the panel data sample averages are reported in the second column.
Among the hypothesis are that public banks and those that operate in more corrupt country environments would on average: i) lend less, ii) have a higher NPL ratio, iii) generate a lower return over equity, iv) have higher equity over assets due to a lower leverage, v) generate less income per employee, vi) have higher costs over assets, and vii) would generate less interest income as a share of the income generating assets. These hypotheses and how they are related to ownership and corruption are described in the third column of Table 1.
Among the main results we have that, on average and controlling by year, country, size and specialization, public banks have a lower credit to asset ratio, higher NPL ratio, and higher equity to asset ratio, which implies that relative to their potential capacity, they lend and recover less. In addition, in countries where corruption is higher, on average, banks have a lower credit to asset ratio. With respect to profitability, public banks have a lower return before taxes as a share of their equity. Income per worker is much lower in public banks. Meanwhile, cost as a share of assets is lower in public banks but is larger as corruption is more prevalent. Finally, interests income as a share of income generating assets is lower in public banks and increases with corruption. These results are reported in the fourth and fifth columns of Table 1.
These results imply that banks with public ownership and operating in more corrupt environments are correlated with banks that lend less, have a higher NPL ratio, generate lower income per worker and interest income per income generating asset, and generate a lower return over equity. Therefore, public ownership and corruption are related to a lower income generation for the public sector. In this sense, public sector’s income generating capacity could be enhanced through improving public’s banks management and through combating corruption.
Table 1. Estimation from a model with Random Effects Generalized Least Squares, controlling for year, country, size, and specialization.
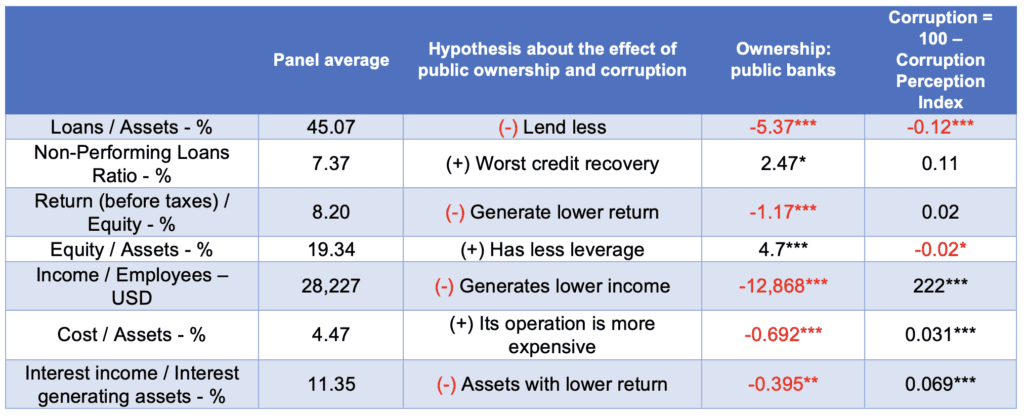
Note: *, ** and *** denote that the coefficient is significant at the 90%, 95% and 99% level, respectively.