National oil companies could be an important source of income in their home-country, giving governments resources to provide public goods and services. Are there differences in these companies’ performance conditionally on ownership related to having publicly traded shares and therefore mixed property and some degree of external control over management? Does the home-country corruption level affect the companies’ production and financial indicators?
To provide answers to these two questions, on the effect of ownership and country-level corruption on companies’ performance, we use the Natural Resource Governance Institute National Oil Company Database (available at https://www.nationaloilcompanydata.org/) and the International Transparency Corruption Index (available at https://www.transparency.org/en/cpi/2022). We use information of 71 national oil companies in 61 countries in operation between 2011 and 2021, and we analyze the behavior of 58 completely public enterprises relative to 13 enterprises that have publicly traded shares and therefore mixed ownership. Country-level measures of corruption are constructed using the International Transparency Perception Index.
To get these results, we estimate the following equation:
Yit=α+β1 * ownershipit + β2 * corruptionit+ηi+uit
where Yit are the companies’ performance indicators, with companies indexed by i, and year denoted by t. ownershipit is a dummy variable which takes a value of 1 if the company does not have publicly traded shares, and therefore ownership is completely public relative to a situation where there is private participation. International Transparency Perception Index is in a 0 to 100 scale with lower values associated to more corrupt countries. To have a direct relationship between our corruption indicator, corruptionit, and the level of corruption, we transform it taking a value of 100 and subtracting the original index.
The estimation is performed with Generalized Least Squares and Random Effects. In the regression we control for year, country, production level and production group. Production levels are measured in barrels of oil, with equivalence for other energy sources as gas, per day. Production levels have the following categories: i) 0, ii) more than 0 and up to 100,000, iii) more than 100,000 and up to 500,000, and iv) more than 500,000 barrels of oil equivalent per day. For production group we have the following categories: i) small domestic producers, ii) medium domestic producers, iii) large domestic producers, iv) internationalized operators, and v) pre-production national oil companies.
The companies’ performance indicators, with sample averages in parenthesis, include: i) total revenue per barrel of production, measured in USD per barrels of oil equivalent ($188), ii) total revenue per employee, measured in USD divided by number of employees ($2,021,316), iii) net income over total revenue before transfers to government, measured in percentage (13.7%), iv) capital expenditure over total revenue, measured in percentage (16.62%) v) operational expenditure over total revenue, measured in percentage (73.36%), vi) transfers to government per barrel, measured in USD per barrels of oil equivalent ($39.70), vii) equity over assets, measured in percentage (26.07%), viii) long-term liabilities over total liabilities, measured in percentage (54.14%), and ix) debt over total revenue, measured in percentage (158.49%). Those indicators are listed in the first column of Table 1, while the panel data sample average is reported in the second column.
Among the hypothesis are that national oil companies that do not have share publicly traded and operate in more corrupt country environments would have: i) lower revenue per barrel of production, ii) lower revenue per employee, iii) lower net income over total revenue, iv) higher capital expenditure over total revenue, v) higher operational expenditure over total revenue, vi) would transfer more resources to the government, vii) would have lower equity over assets, viii) would have larger long-term liabilities as a share of total liabilities and ix) higher debt over total revenue. These hypotheses and how they are related to ownership and corruption are described in the third column of Table 1.
Among the results are that income per barrel of oil, return per worker and the return before taxes as a share of income are lower in corrupted environments and in completely public oil companies. Capital expenditure and operational expenditure as a share of income are higher in corrupt environments and in completely public oil companies. In addition, completely public oil companies transfer a larger share of resources to the government and have a lower level of capitalization. In environments with higher corruption, oil companies have a larger share of long-term liabilities and higher debt levels, which is even higher for completely public companies. These results are reported in the fourth and fifth columns of Table 1.
These results imply that for national oil companies without mixed ownership, through public traded shares, and operating in more corrupt environments, production and income levels are lower, while expenditure, long-term liabilities, and debt are larger. In this sense, public sector’s income generating capacity could be enhanced through external monitoring of national oil companies and through combating corruption.
Table 1. Estimation from a model with Random Effects Generalized Least Squares, controlling for year, country, production level and production group.
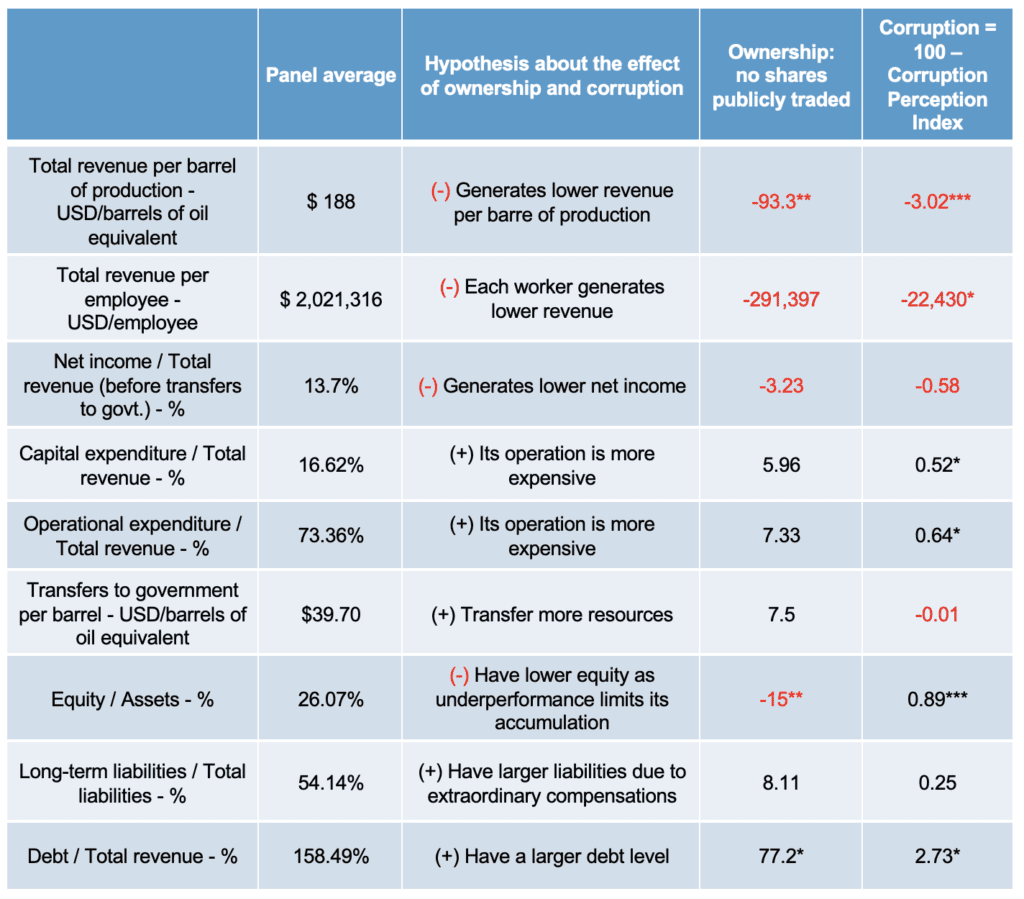
Note: *, ** and *** denote that the coefficient is significant at the 90%, 95% and 99% level, respectively.